In my previous blog we have seen how to connect to excel files to get the data. Now let us go ahead, do some data modeling and data transformation for this data before we start developing reports. I was looking for good example to explain Power BI capabilities and recently saw one excellent Power BI case study on IPL which is Indian Premier League analytics by ashishrj which can be referred below:
https://community.powerbi.com/t5/Data-Stories-Gallery/IPL-Data-Analysis-2008-2016/td-p/141219
Thanks to Ashish for this creative work and inspiring me to write this post.
You can get free data sources for analysis, POC purposes on internet as mentioned below.
https://catalog.data.gov/dataset?vocab_category_all=Asian
https://www.gapminder.org/data/
https://www.springboard.com/blog/free-public-data-sets-data-science-project/
https://www.yelp.com/dataset/download
I am using the data source for IPL from 2008 to 2017 which is freely downloadable from the internet. Let us start how we can develop efficient and beautiful reports in Power BI with IPL Data.
Those who do not know what is IPL, it is a professional Twenty20 cricket league in India contested during April and May of every year by teams representing Indian cities and some states. Hence this data consists of ball by ball details of the matches played until last year along with details about the teams, players etc.
Here I got five CSV files consisting of various information of the IPL matches.
The names are really intuitive to understand the content of the data.

We will create the reports as shown in below snippets.


Let us start with Power BI desktop. As mentioned in earlier posts, we will upload these five excels in Power BI desktop and start developing the report.
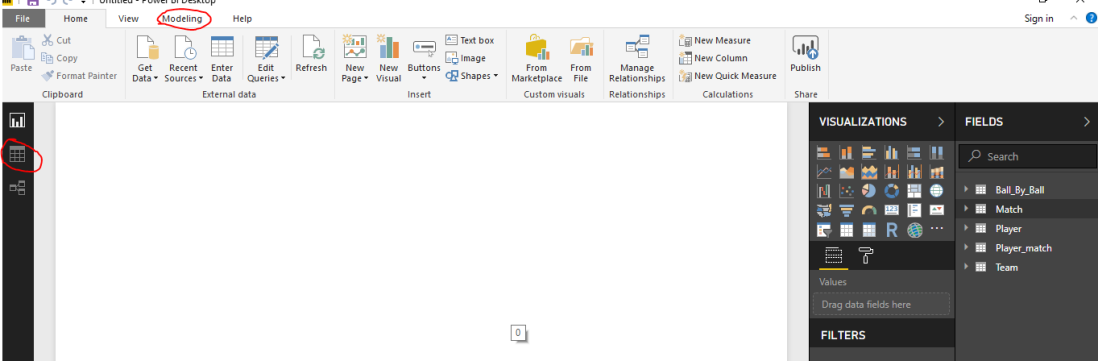
Once we get data from these excels in tables, we can start with data modeling. Referring to below screenshot, let us click on the Modeling.
- Column Category:
Let us say we want to show the number of matches played per location. Such information is available in Match table, however we have do to few changes in the data category so that it is identified as geographic locations. To achieve this, you can click on either Modeling menu or click on data icon on the left side bar as shown in above screenshot.
Kindly refer the below screenshot for next step. Select the CityName column and look at the data category. It is showing uncategorized, however we want Power BI to identify this as a location i.e. city. Hence select City from the drop down. You can see there are various standard options to categorize your data columns for ease of reporting such as Address, City, Continent , Region, Longitude and Latitude etc

Once City is selected, you would see one icon near column and this column can be used to show the geographical visuals. Similarly we can use other location fields and change their category to use those in geographical visuals.
Relationship in data tables:
We have different tables and would need to some connect between the tables for better visualizations. Power BI desktop automatically identifies the relationship in the tables based on the identical columns. if you click on the Manage relationships or click on the icon on side bar, you can see the relationships as shown in below snippet

By default, Power BI identifies below relations in the tables, based on our requirement and understanding, we can create more relations as we are used to create in SQL server management studio
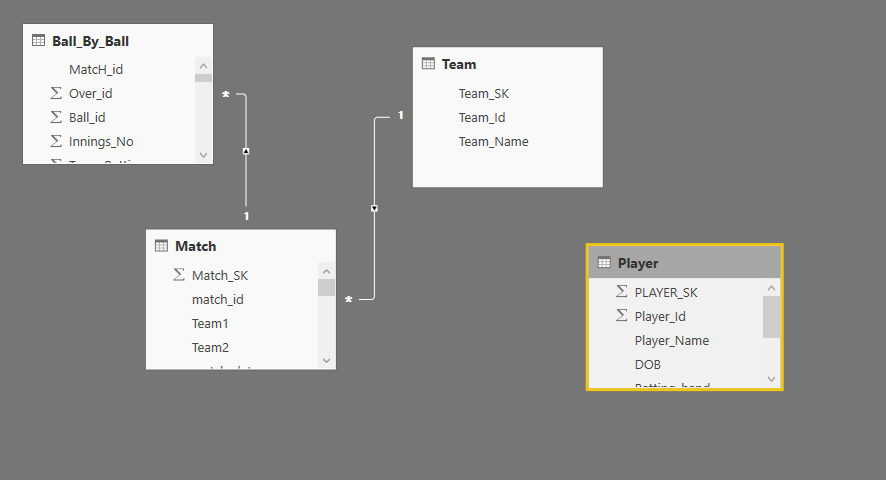
You can edit existing relationships or create new ones based the data and type as many to one, one to one etc


This way you would be able to achieve relationships in tables, tables can be from different data sources. Once you practice, more features can be explored.
We have seen few techniques of data modeling in Power BI using Power BI desktop in this blog. Let us see some more techniques of data modeling and data transformation in my next blog.
Thank you for reading my blog, if you have any questions please mention in the comments and hit the like button if you like my write up.
Keep Learning !! Happy analyzing and be Powerful 🙂
Power BI: IPL Analytics- Dashboard
Power BI: Measures Vs Calculated Column
Power BI Jargons: DAX/M/Power Query
Power BI: IPL Analytics- Visualizations and Design Reports -Part 7
Power BI: IPL Analytics- Visualizations and Design Reports -Part 6
Power BI: IPL Analytics- Visualizations and Design Reports -Part 5
Power BI: IPL Analytics- Visualizations and Design Reports -Part 4
Power BI: IPL Analytics- Visualizations and Design Reports -Part 3
Power BI: IPL Analytics- Visualizations and Design Reports -Part 2
Power BI: IPL Analytics- Visualizations and Design Reports -Part 1
Power BI: IPL Analytics- Data Modeling and Transformation-Part 2
Power BI: IPL Analytics- Data Modeling and Transformation-Part 1
Start with Power BI: Connect to Data Sources

Thank you so much for sharing this Ma’am. It is really very helpful for me as I have started learning Power BI.
LikeLiked by 1 person
Thanks Amit. Please follow the series, you would be able to learn most of the Power BI.
LikeLike