In my earlier blogs, we have seen how to develop Reports using Power BI desktop. Let us use these reports, publish those in Power BI service and create Power BI dashboards.
Once we have detailed reports available in Power BI desktop, we can publish those in Power BI service. As we have seen in earlier post of deployment models, if we want to share the Power BI report, publishing the report to Power BI service is one of the options.
Open the report in Power BI desktop and go to Files, select Publish, this will give an option to Publish to Power BI. Once we click on this, it opens a window and asks for credentials to connect to the Power BI subscription. Once we enter the credentials, it connects and asks if report to be deployed to which workspace. Select the workspace, or default my workspace would be selected.

Once we publish the report , we get success message. We can open this report either directly from here by clicking on the link as shown in the below snippet or by going to workspace and locating the report to open.

Now let us see how Power BI Service UI looks like and what features it provides. As soon as we open the Power BI Service, it shows below UI. If you see on left hand side menu, various options are displayed. 

At the bottom we can see Workspace, which has default My Workspace. Once we click on My Workspace, we can see all components of the workspace such as dashboards, Reports , workbooks and DataSets. In the below snippet, under reports section we can see recently published report. We can open that report.
Report would be displayed as shown below. Here we can edit report, however we neither do any ETL activity nor any DAX calculations. We can edit the report in terms of visuals, ask questions and add additional visuals etc. You can click on Edit report and start editing the report.
I would recommend that one should go though various options available in the menu and explore the components as shown in below snippet.


Let us create a dashboard in Power BI. We already have reports developed in Power BI, As we think of Dashboard, we think of some important information which should highlighted. Hence few information from the report would be pinned to dashboard. As shown in below snippet, for every visual in the report, there would be a pin icon shown at the top left side. e.g. click on the pin icon of Overs Bowled visual.
As we click on this pin icon, it will give below screen asking if it is to be pinned to existing dashboard if any dashboard is already created, or to a new dashboard. we can decide as per our requirement.

I am selecting new dashboard and naming it as IPL Dashboard as shown in below snippet and click on the Pin button. Power BI would create the new dashboard and pin this visual to the dashboard. We can directly navigate to the dashboard from Go To Dashboard button as shown in below snippet or can even create phone view of the dashboard.

Visuals which are pinned to the dashboard are called Tiles in dashboards. for each tile , can take below actions by clicking on the three dots at top right of the tile . If we click on the tile from the dashboard, it would navigate to the report. We can try to explore what every action does and meant for.

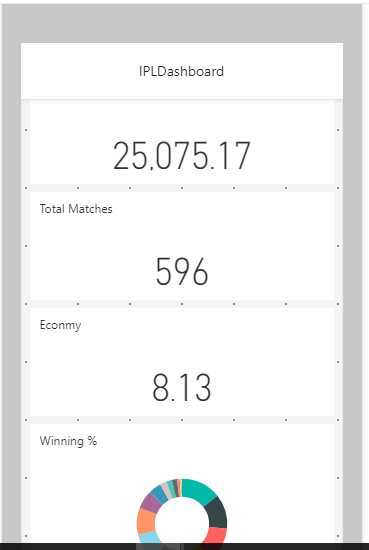
We can also view the mobile view of the dashboard as shown in below snippet


In this blog we have understood about the Power BI service and how create dashboard from Power BI report.
Thank you for reading my blog, if you have any questions please mention in the comments and hit the like button if you like what I am writing.
Keep Learning !! Happy analyzing and be Powerful 🙂
Power BI: IPL Analytics- Dashboard
Power BI: Measures Vs Calculated Column
Power BI Jargons: DAX/M/Power Query
Power BI: IPL Analytics- Visualizations and Design Reports -Part 7
Power BI: IPL Analytics- Visualizations and Design Reports -Part 6
Power BI: IPL Analytics- Visualizations and Design Reports -Part 5
Power BI: IPL Analytics- Visualizations and Design Reports -Part 4
Power BI: IPL Analytics- Visualizations and Design Reports -Part 3
Power BI: IPL Analytics- Visualizations and Design Reports -Part 2
Power BI: IPL Analytics- Visualizations and Design Reports -Part 1
Power BI: IPL Analytics- Data Modeling and Transformation-Part 2
Power BI: IPL Analytics- Data Modeling and Transformation-Part 1
Start with Power BI: Connect to Data Sources

7 thoughts on “Power BI: IPL Analytics- Dashboard”