In earlier blogs, we have understood various jargons in Power BI. To add to these jargons further, there is concept called Measures in Power BI. Generally this term gets confused with calculated columns.
Let us see what Measures is all about and if it is really an alternative to Calculated columns. Actually its not!!
We have seen how to add calculated column in earlier blogs such as Win_by_Runs. Here we wanted to know the number of runs by which the match was won, and it was for every match. Hence the calculation was for row wise and result is shown row wise.
In short, Calculated columns use the context of the row and provide calculation row wise. Hence whenever we need any such calculation at row level, we have to use the calculated column.
On the other side, if we need any calculation as aggregation of the entire data or based on any filter, we have to use Measures. In our IPL data, if we want to see total runs for all matches, we need this as aggregation of values of one column and all rows. This can be achieved by Measures.
Let us go back to our IPL example again to see how it works. If we want to know total runs scored. Below are the steps to create the Measure.
Navigate to Modelling tab, Select the table in which you want to add the measure and click on New Measure as shown in below snippet.

By default the Measure 1 will be the name for this Measure, depending on how many measures we have already added in this. Here I already have few measures created, hence its showing Measure 3 as shown in below snippet.
![]()
Let us change the name and add the formula as shown in below snippet.

Here we have to understand that, unlike the columns, Measure will not be seen as a column in the table, and will be available only as formula to be calculated at runtime.
Hence we won’t be able to see the result of this formula now.

If we want to see the output of this measure, we need to add this to Report and can see the value. Either we can directly drag this measure to report and see the bar chart by default or add a card visual and then select the measure as field. This will calculate the value of the measure and display on the visual.

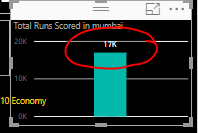
We can also add filters to the measures. If we want to see the total runs scored in Mumbai location, we can write use the formula as Calculate and add filter using match formula as shown in below snippet.
If we see the output of this filtered measure, we can see total runs scored in Mumbai as shown in below snippet.

Summing up the Measures vs Calculated Columns comparison considering three parameters
- Memory utilization:
- Calculated column is stored in the in memory of the database and it will consume the memory even if nobody is querying this column. However while user interacts with reports, there is no impact on user’s virtual memory utilization
- Measures is always calculated at run time, it actually impacts the virtual memory, however it saves in memory of the database. Hence one should be careful while adding measures in the Power BI
- Evaluation Context:
- Calculated column to be used when calculation is in row context
- Measures to be used when aggregation is expected from multiple rows
- Visibility
- Calculated columns’ output is visible in the table as soon as they are created
- Measures’ output is not visible until we add it to the report in terms of visual
Thank you for reading my blog, if you have any questions please mention in the comments and hit the like / share button if you like my article.
Keep Learning !! Happy analyzing and be Powerful 🙂
Power BI: IPL Analytics- Dashboard
Power BI: Measures Vs Calculated Column
Power BI Jargons: DAX/M/Power Query
Power BI: IPL Analytics- Visualizations and Design Reports -Part 7
Power BI: IPL Analytics- Visualizations and Design Reports -Part 6
Power BI: IPL Analytics- Visualizations and Design Reports -Part 5
Power BI: IPL Analytics- Visualizations and Design Reports -Part 4
Power BI: IPL Analytics- Visualizations and Design Reports -Part 3
Power BI: IPL Analytics- Visualizations and Design Reports -Part 2
Power BI: IPL Analytics- Visualizations and Design Reports -Part 1
Power BI: IPL Analytics- Data Modeling and Transformation-Part 2
Power BI: IPL Analytics- Data Modeling and Transformation-Part 1
Start with Power BI: Connect to Data Sources
8 thoughts on “Power BI: Measures Vs Calculated Column”