In my previous blog, we have seen few steps to design Power BI report. Let us continue to develop this report by adding different visualizations of this data for the IPL Analytics in this blog.
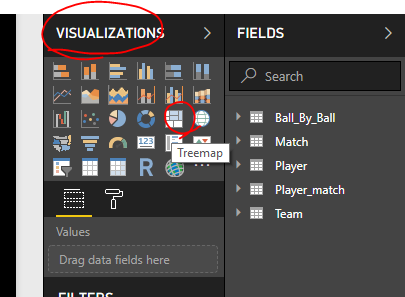
Now let us create our first Power BI Chart in first Power BI report which is at the center top of the report- “Select Season year”. Let us use the Treemap chart to create this visualization. Power BI gives you the flexibility to drag and drop the charts on the report page and configure the same.
Let us follow the steps as shown in the below snippets and configure the chart.
Drag and drop the Treemap visualization on the page at top and center position of the page.

Once the visualization is dropped on the page and it is selected, we can see its properties in the right section below the chart icons.
Adding Data fields for X and Y axis: We want to show the year and count of matches played during that year. Select the match_id from the Match table. Drag and drop this field in the value box as shown in below snippet. It would be count of matches
 As we need to group the match count by season year, select the Season year field and drop under group section.
Resize the chart as shown in below snippet.

If we want to display all the blocks in same color, we can go in the report formatting section and apply same color to all the data boxes as shown in side snippets. If you really want to go ahead and explore the Power BI capabilities, try to play with various properties of the charts/visualizations and understand more.


We have completed configuring our first chart in Power BI report.
Let us continue to develop this report by adding more visualizations in my next blog. I am sure you would love to do this with me.
Thank you for reading my blog. If you have any questions, please mention in the comments and hit the like button if you like my write up.
Keep Learning !! Happy analyzing and be Powerful 🙂
Power BI: IPL Analytics- Dashboard
Power BI: Measures Vs Calculated Column
Power BI Jargons: DAX/M/Power Query
Power BI: IPL Analytics- Visualizations and Design Reports -Part 7
Power BI: IPL Analytics- Visualizations and Design Reports -Part 6
Power BI: IPL Analytics- Visualizations and Design Reports -Part 5
Power BI: IPL Analytics- Visualizations and Design Reports -Part 4
Power BI: IPL Analytics- Visualizations and Design Reports -Part 3
Power BI: IPL Analytics- Visualizations and Design Reports -Part 2
Power BI: IPL Analytics- Visualizations and Design Reports -Part 1
Power BI: IPL Analytics- Data Modeling and Transformation-Part 2
Power BI: IPL Analytics- Data Modeling and Transformation-Part 1
Start with Power BI: Connect to Data Sources

12 thoughts on “Power BI: IPL Analytics- Visualizations and Design Reports -Part 2”